Dashboards hand you a hundred numbers and wish you luck. KPI360 watches every order and every shift, tells you the two or three things that are actually costing you money, prescribes the fix with a dollar figure and an owner — then follows up until the number comes back, and shows you what it recovered. Every figure is checked against your POS before it is stated — and where your books and your till disagree, you are shown the gap rather than an average of the two.
This is one case, from open to receipt. Other tools generate insights. Ours are followed up and measured.

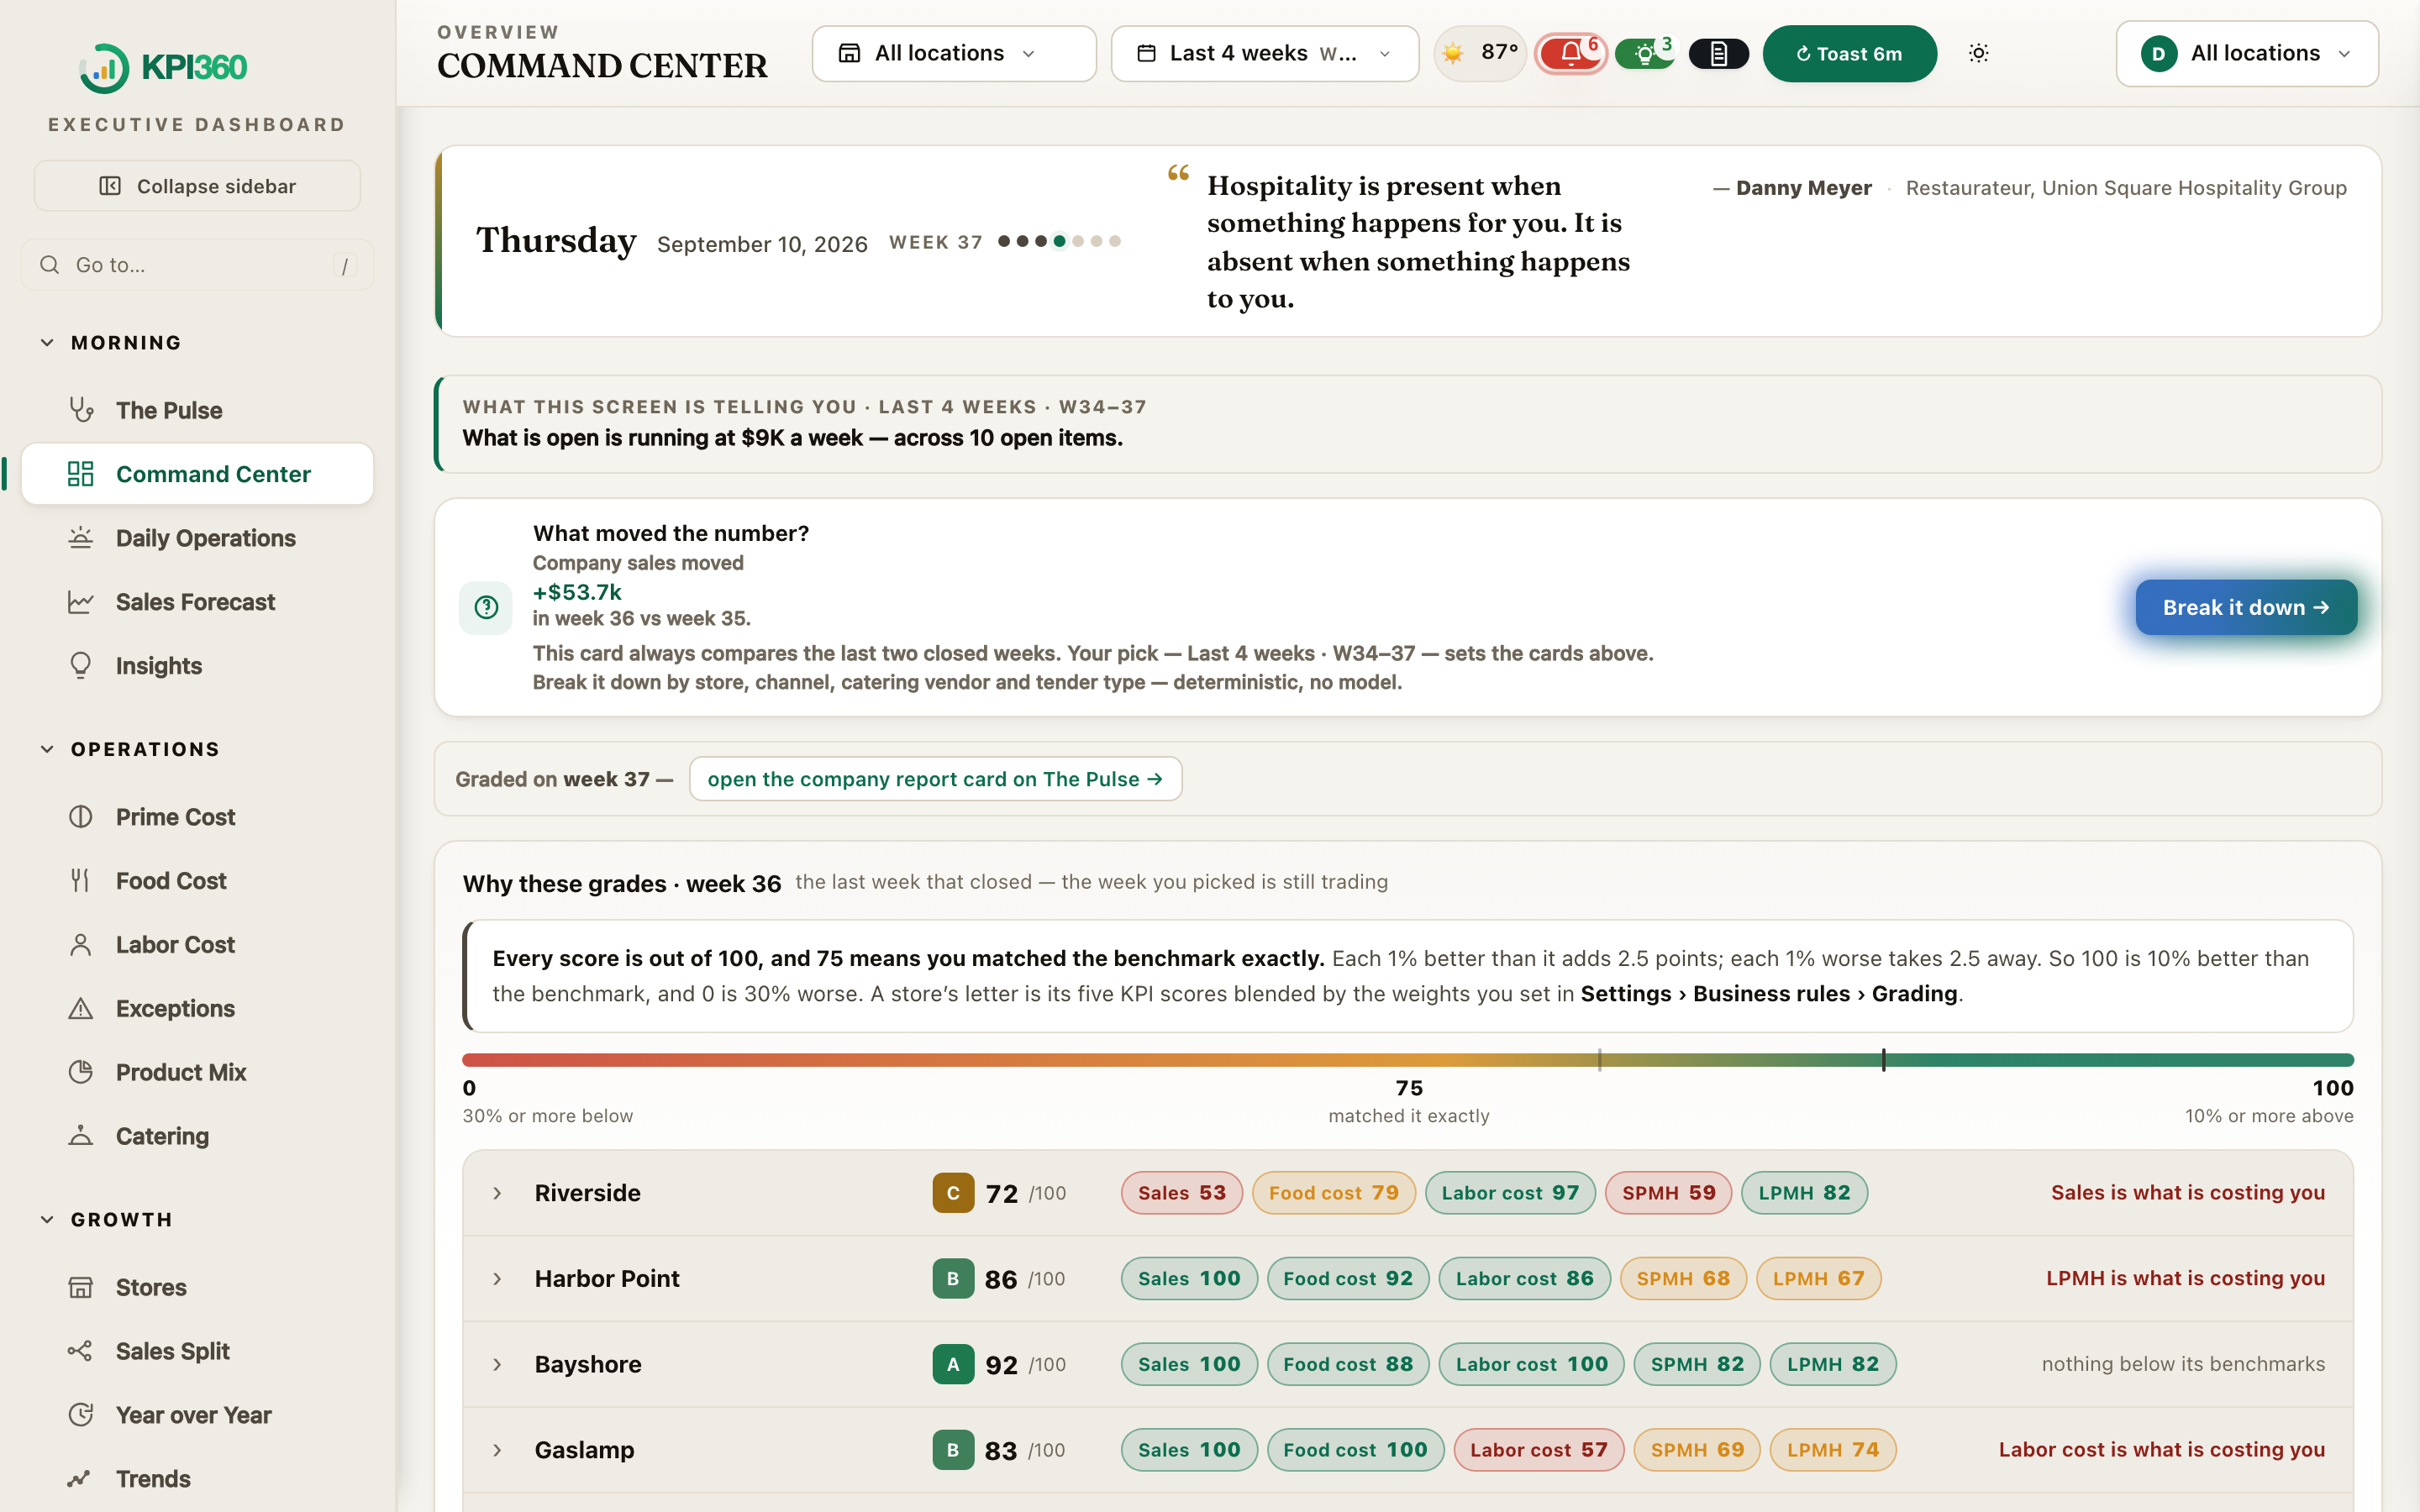
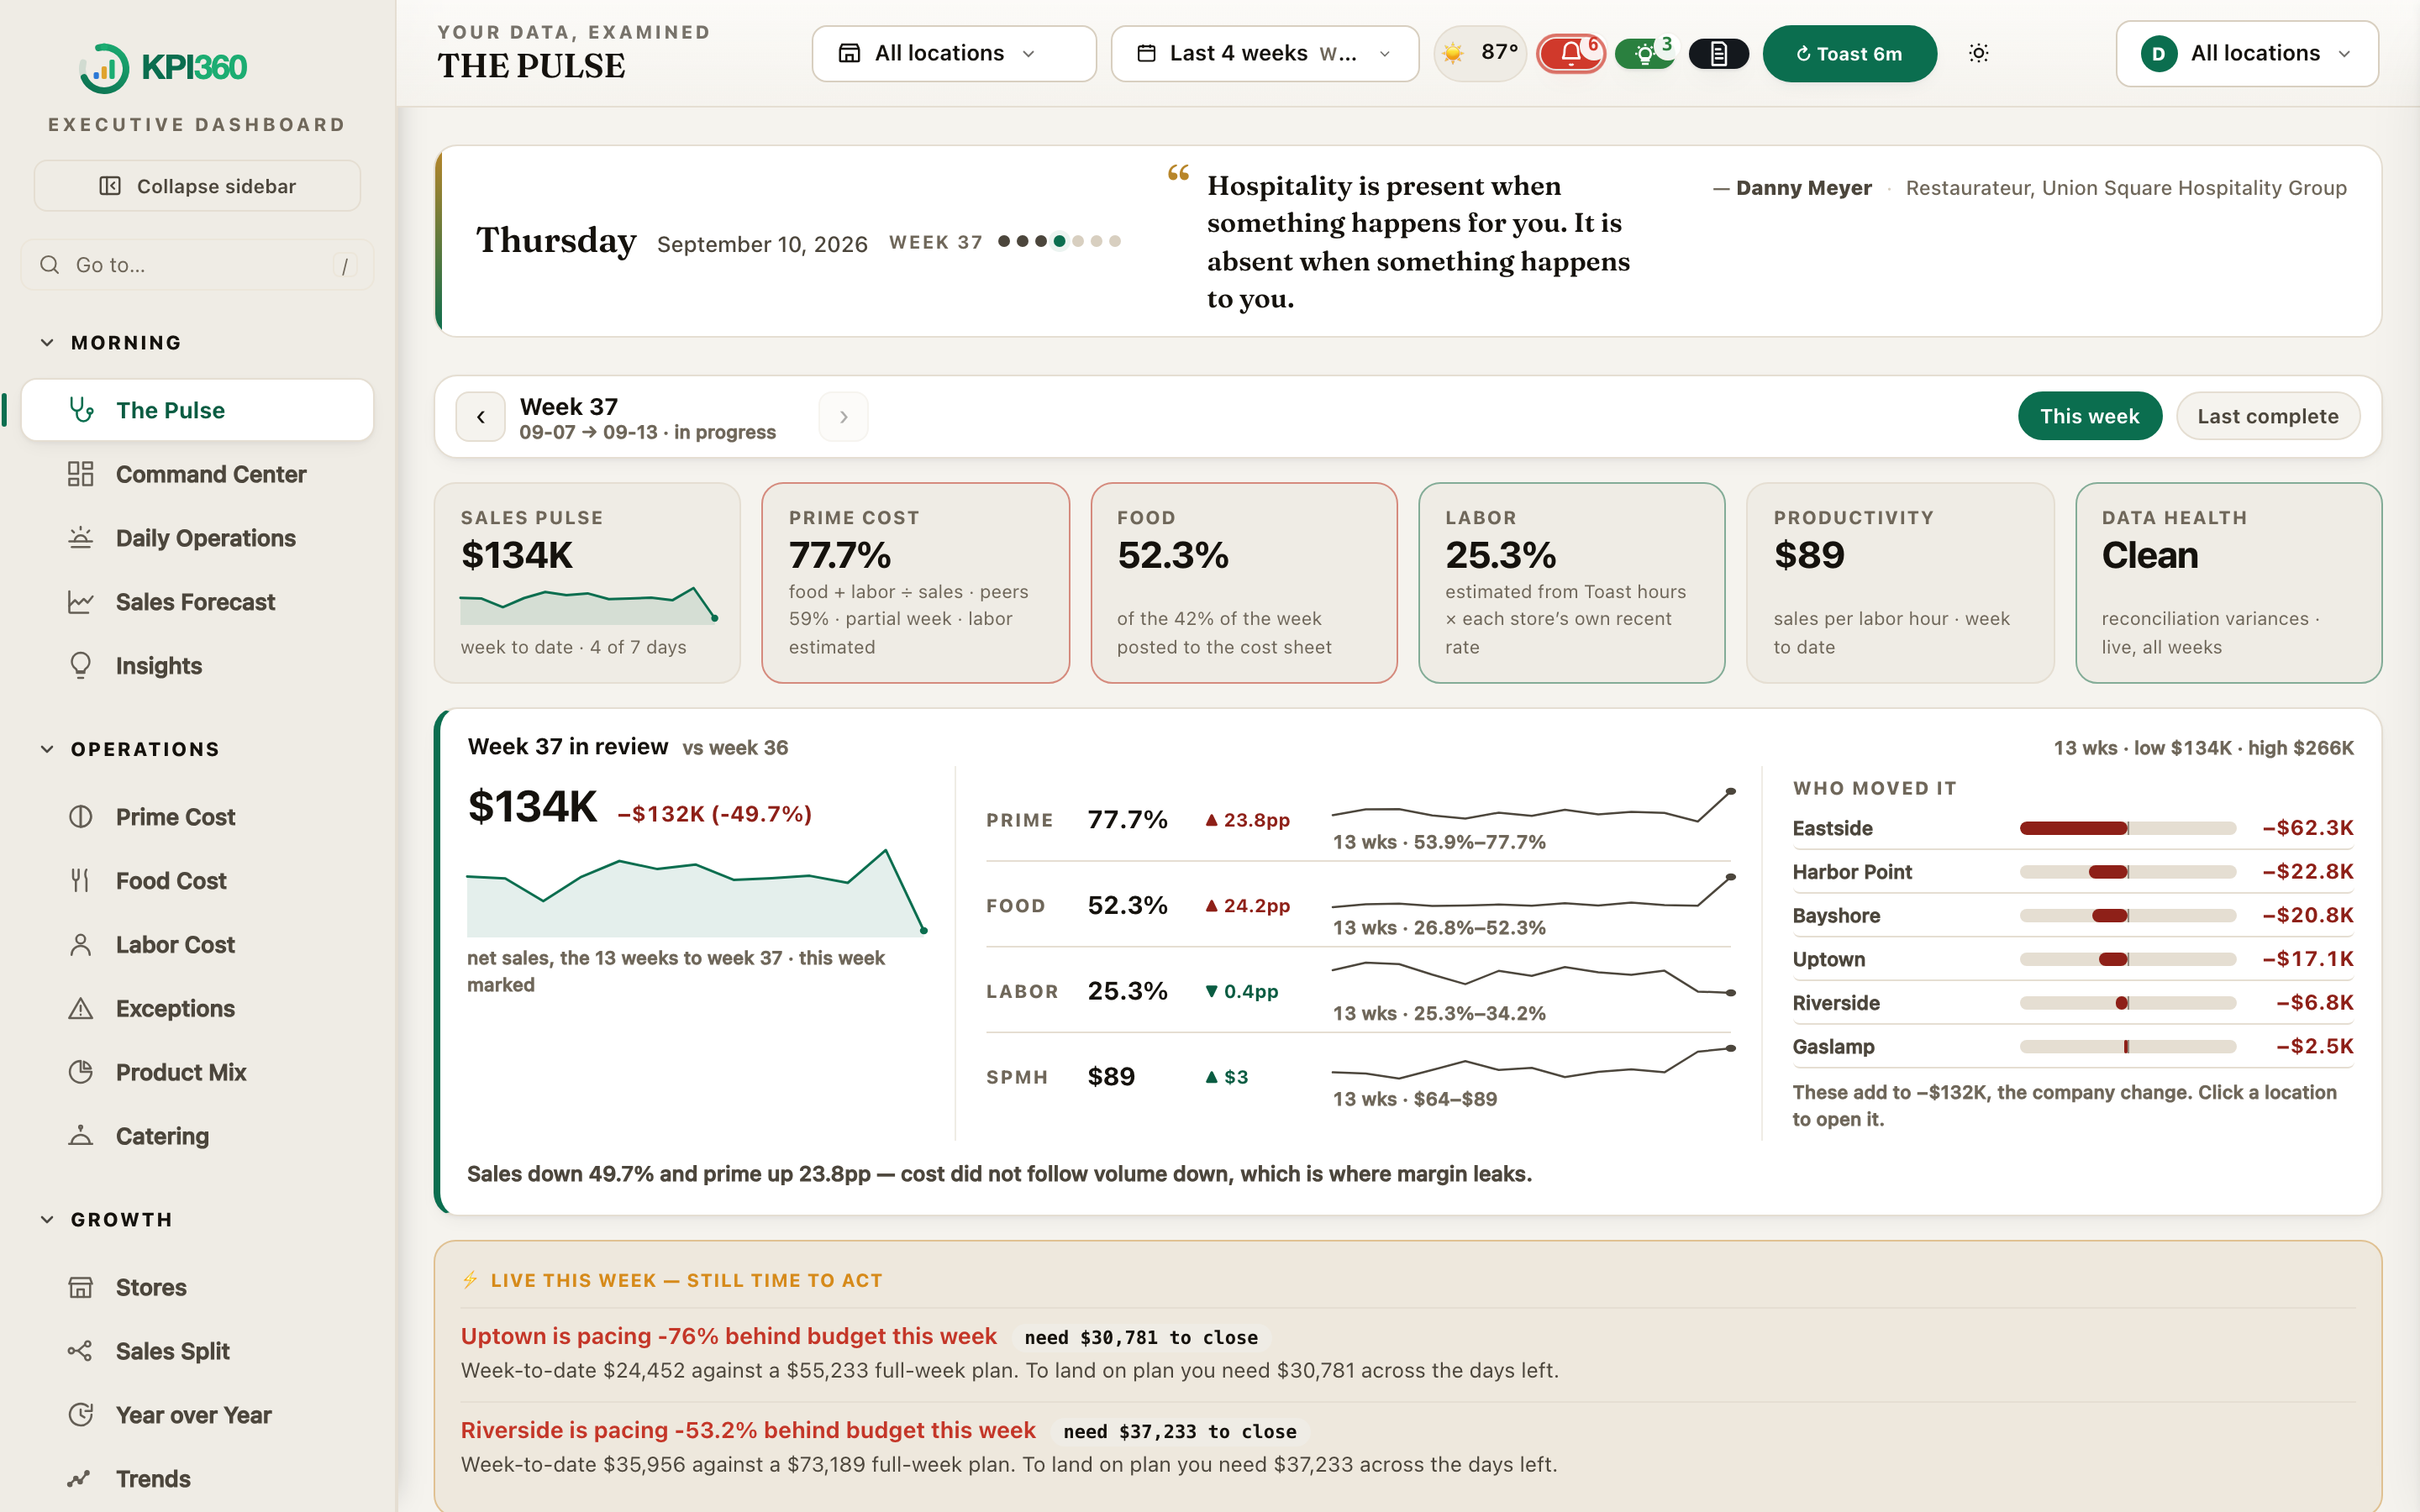
Not a mock-up. This is the live product, photographed this week — every figure on it opens the days, locations and receipts underneath.
Running restaurants has never been tighter: 42% of operators weren't profitable in 2025, and total costs are up 36% since 2019. When the leak is bigger than the margin, the difference between a profitable year and a losing one is simply whether anyone catches it. That is KPI360's entire job — watch every order and every shift, flag the drift the week it starts, prescribe the fix, and measure what fixing it was worth.
Sources: National Restaurant Association State of the Industry & 2025 Operations Report; industry cost surveys, 2019–2026. The 4–8% figure is precisely the leak KPI360's watchdogs, drift checks, and morning briefs exist to catch.
KPI360 runs in production today across 12 restaurant locations, $20M of annualised sales and 603,000 transactions — groups running full cost sheets alongside groups running nothing but their POS. Every number below came out of that live data, not a model — counted on 24 September 2026, the way the screenshots below are dated.
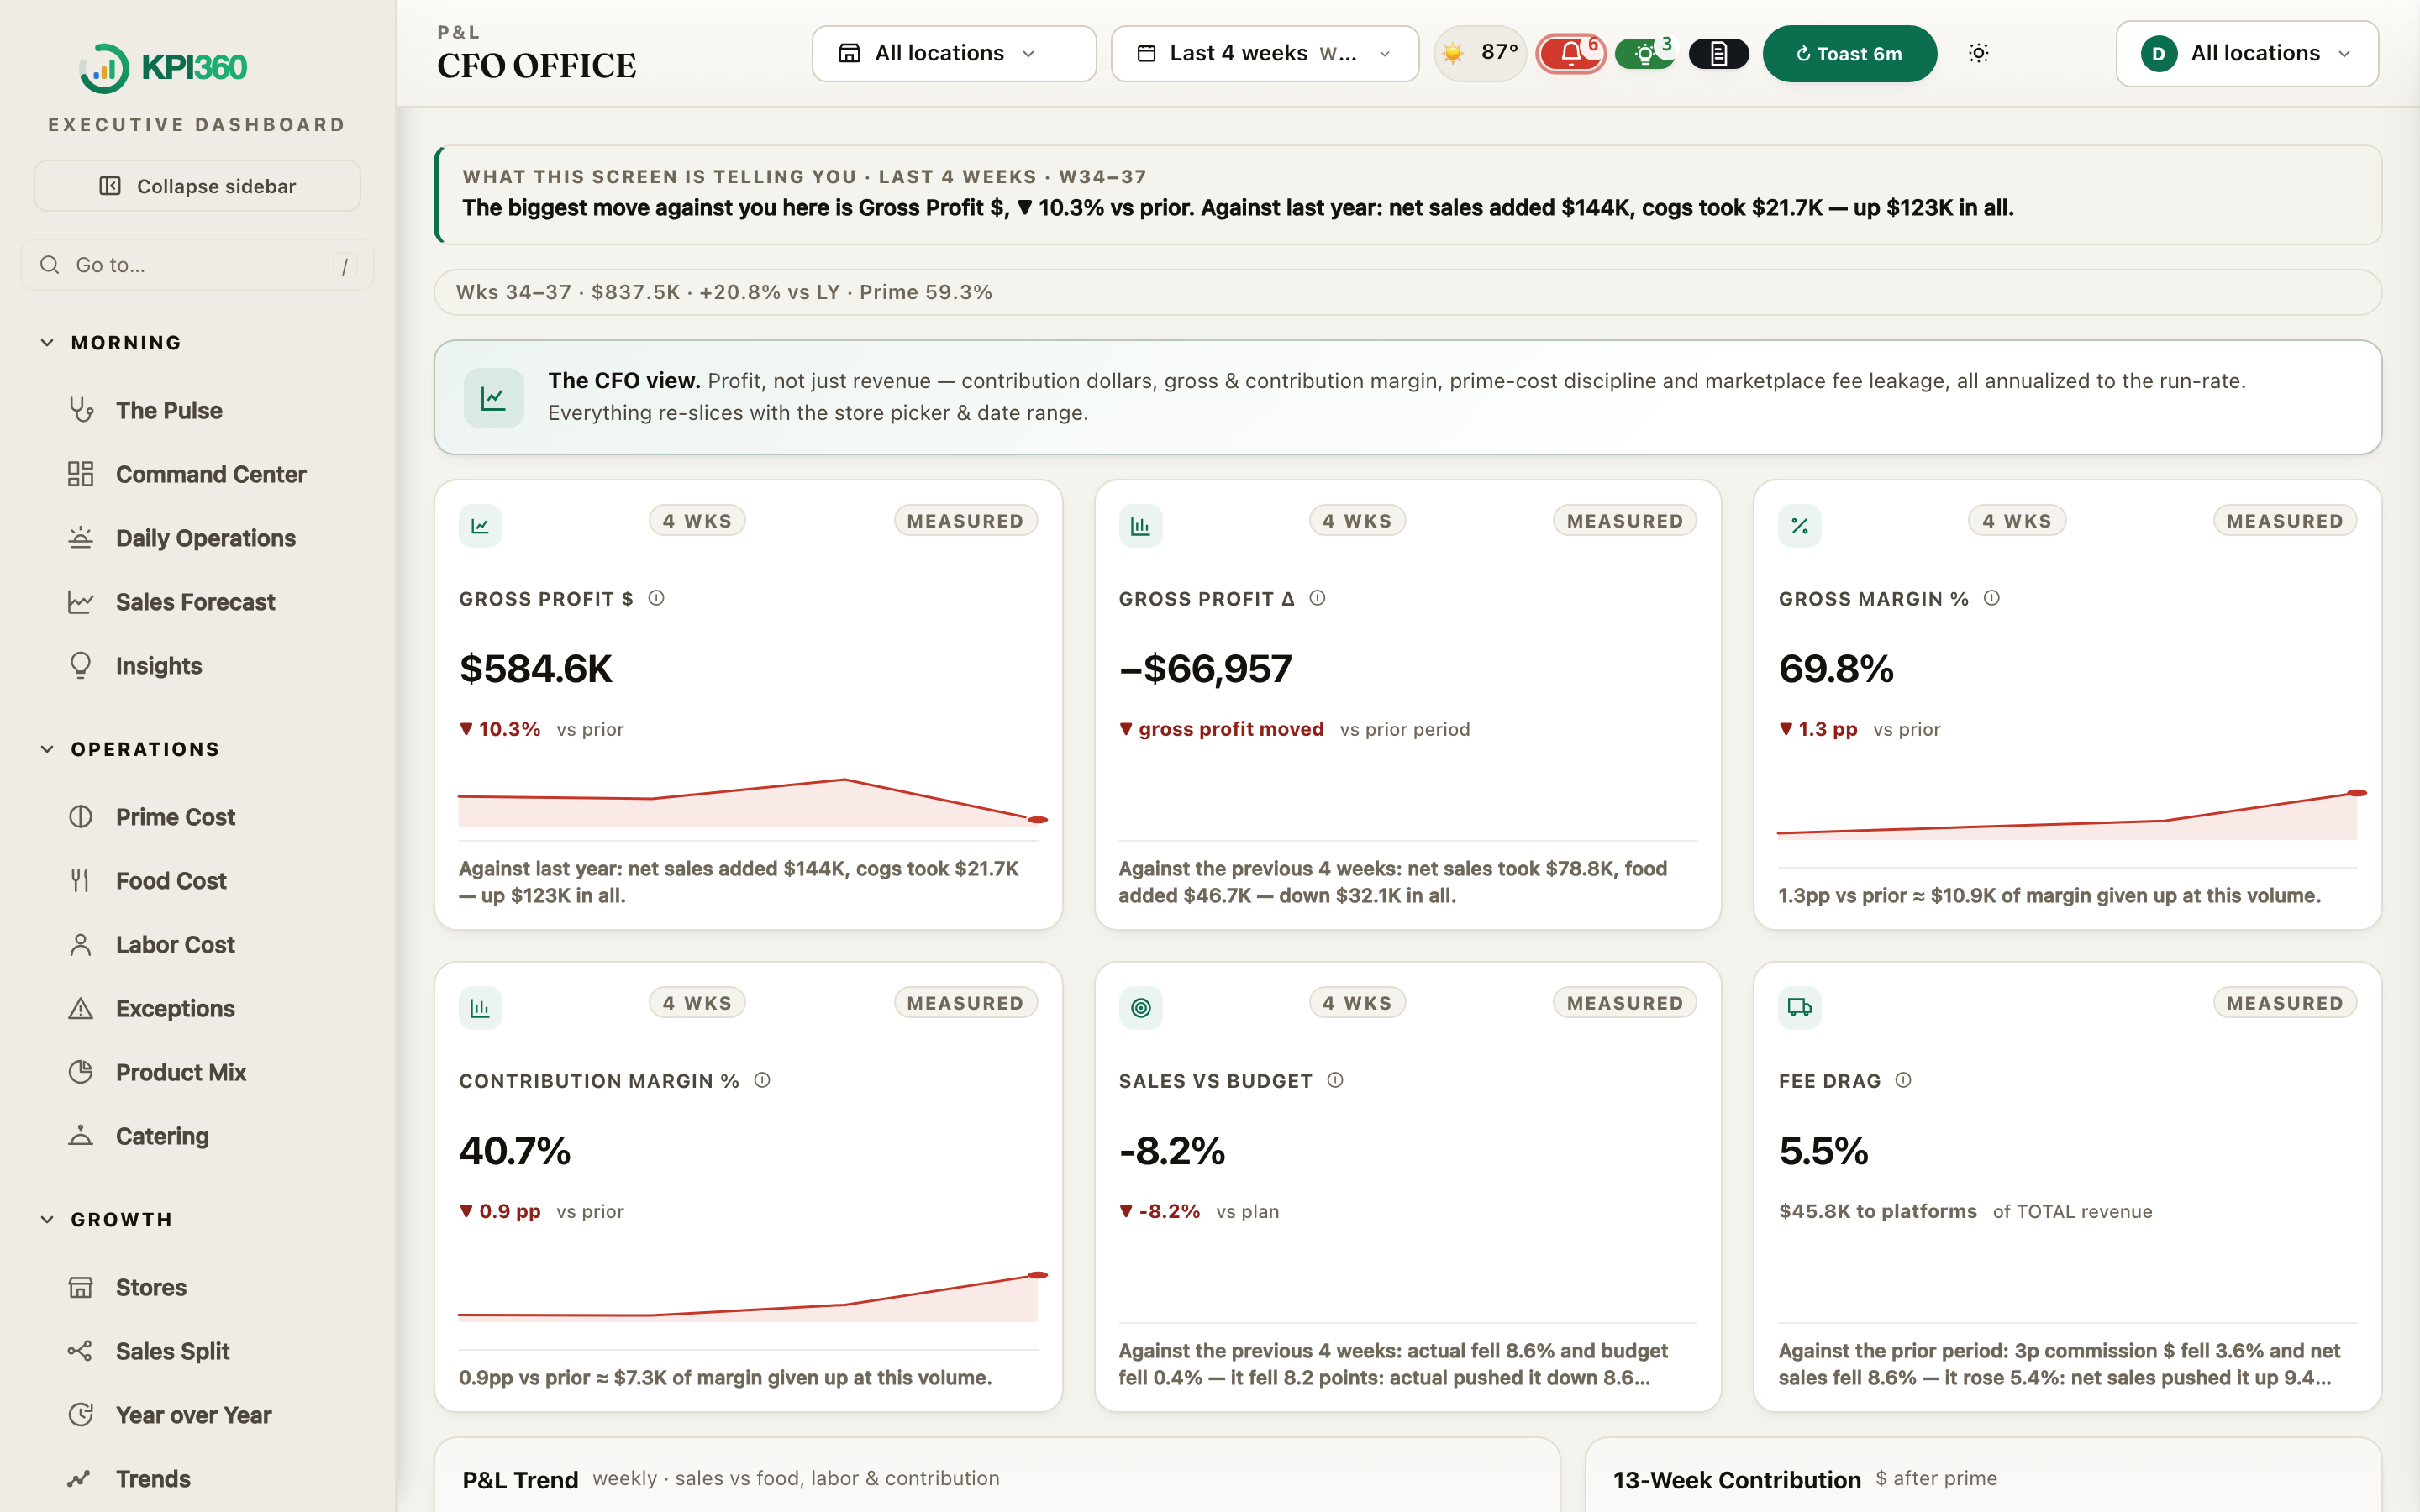
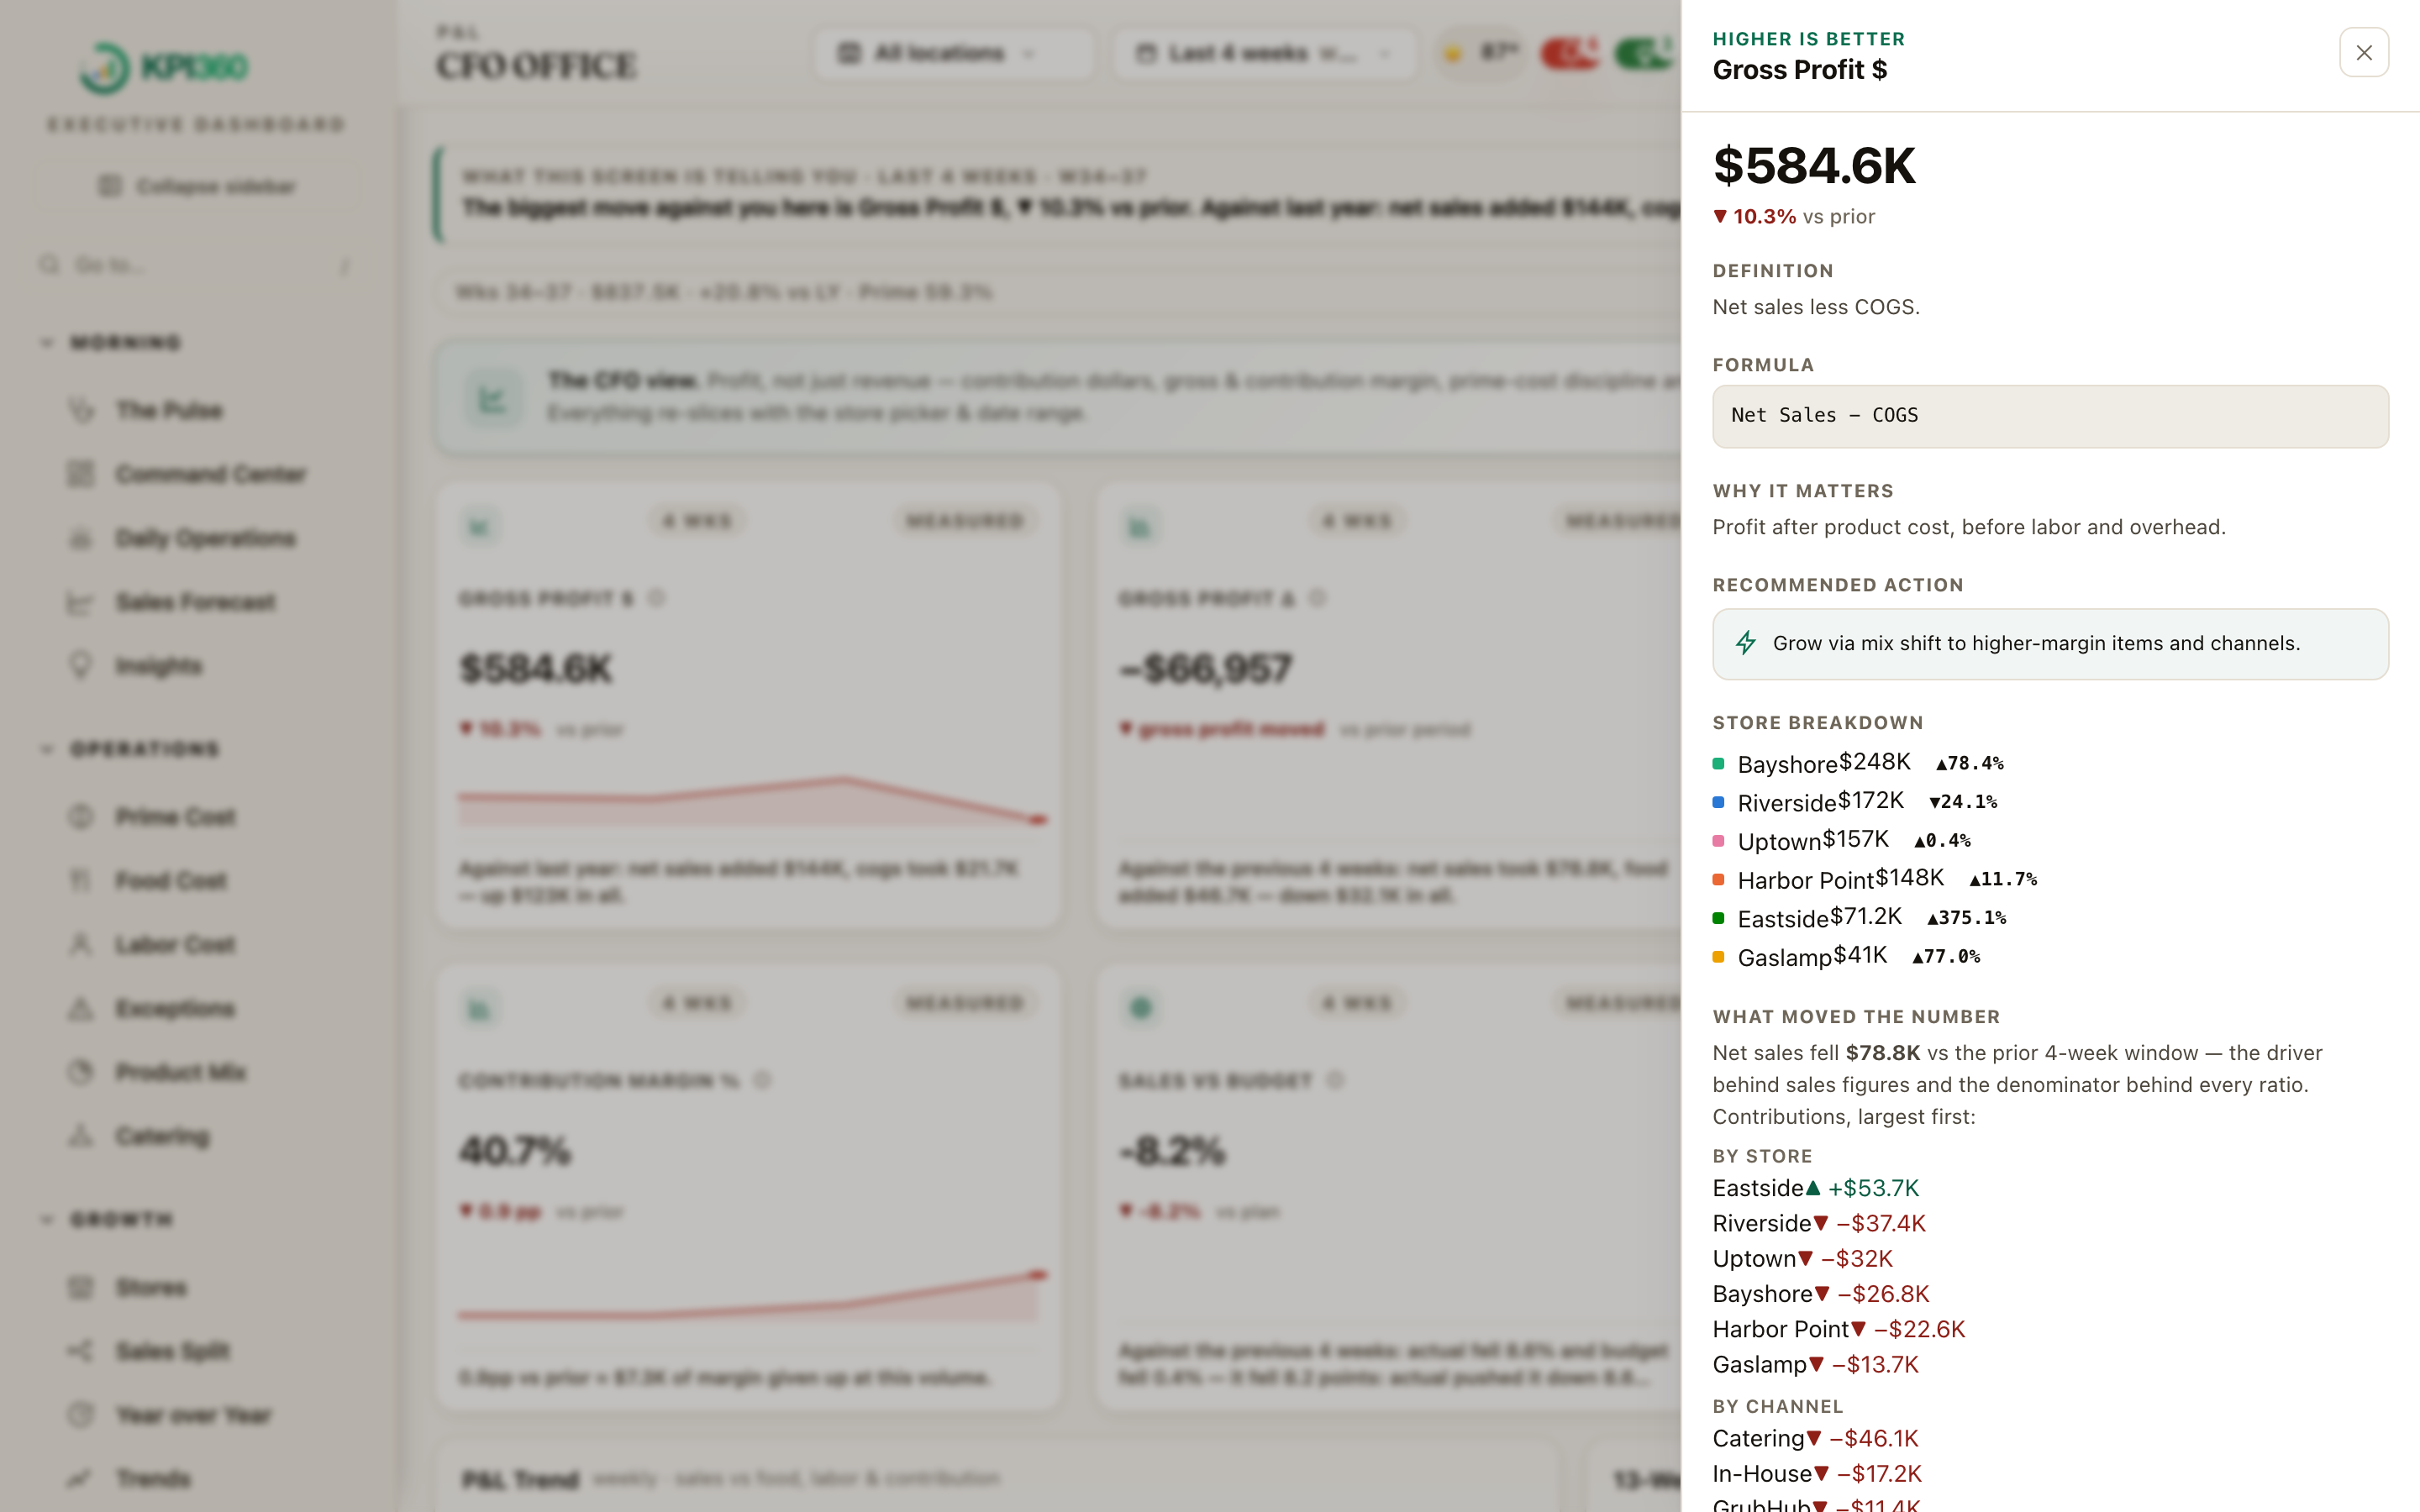
Captured from the live demo by a script when a release ships — refreshed at release time, not daily, and never rotated — so what you see here is what ships. Open the demo yourself and click any number on any of these screens. Click a photograph to see it full size.

What is wrong, what it costs, what to do, and whether the last fix worked.

A real profit and loss from the till, the cost sheets and the books — reconciled.

Every figure carries its definition, its formula, the locations behind it and what moved it — down to the day and the receipt. This is the difference between a dashboard and something you can act on.
Photographed 10 September 2026 from the public demo — sample data, real software.
Built for an operator who has ninety seconds, not ninety minutes.
A per-store huddle: yesterday, this week vs plan, food and labor pace, and one focus for the day — live from Toast.
Exceptions first, capped so it's never noise: budget misses, food creep, labor pacing into OT.
Every item ranked by units, revenue and % of mix, with movers and an AI read on concentration and pricing.
Register, kiosk, online, Uber, DoorDash, Grubhub and catering — all locations side by side.
The AI drafts the renegotiation email, the schedule trim, the next move — behind your one-click approve gate.
Toast vs your books reconciled, A–F store report cards, and a forecast that's backtested — not guessed.
Weather, holidays, paydays, school breaks, street closures, your own promotions and closures. Each store's own measured response to each one moves tomorrow's forecast and the labor plan behind it — and the screen says why.
What each plate costs to put out, from your item costs and your mix — so the menu is ranked by the margin it earns, not the price on the board. Per-item purchase prices join when your invoices are connected.
Every number on every screen carries its own coverage. A missed sync, a sheet nobody filled, a restaurant that was closed, a feed you have not connected yet — each is shown as an absence, with the reason, and never as a zero pretending to be a measurement.
It is the least glamorous thing in the product and the reason the rest of it is worth reading. A dashboard that prints $0 for money it never looked at has taught you not to trust the numbers beside it.
Not a footnote and not a tooltip. It is written on the card, in words, before you decide anything on it.
A dashboard number is usually just a number. Here every KPI card carries three more things: what kind of number it is — a measured total, a rate, a share, an estimate; how sure it is — measured, estimated, or incomplete, with the reason; and why it moved — the part of the formula that did the moving, in one sentence.
Estimated from Toast hours at each store’s own recent cost per hour, until payroll posts. Up 1.4 points on last week: hours rose 6% while sales held flat, so the numerator did the moving. Not paced — a rate is already a rate.
An example card, worded the way the product words it — sample figures.
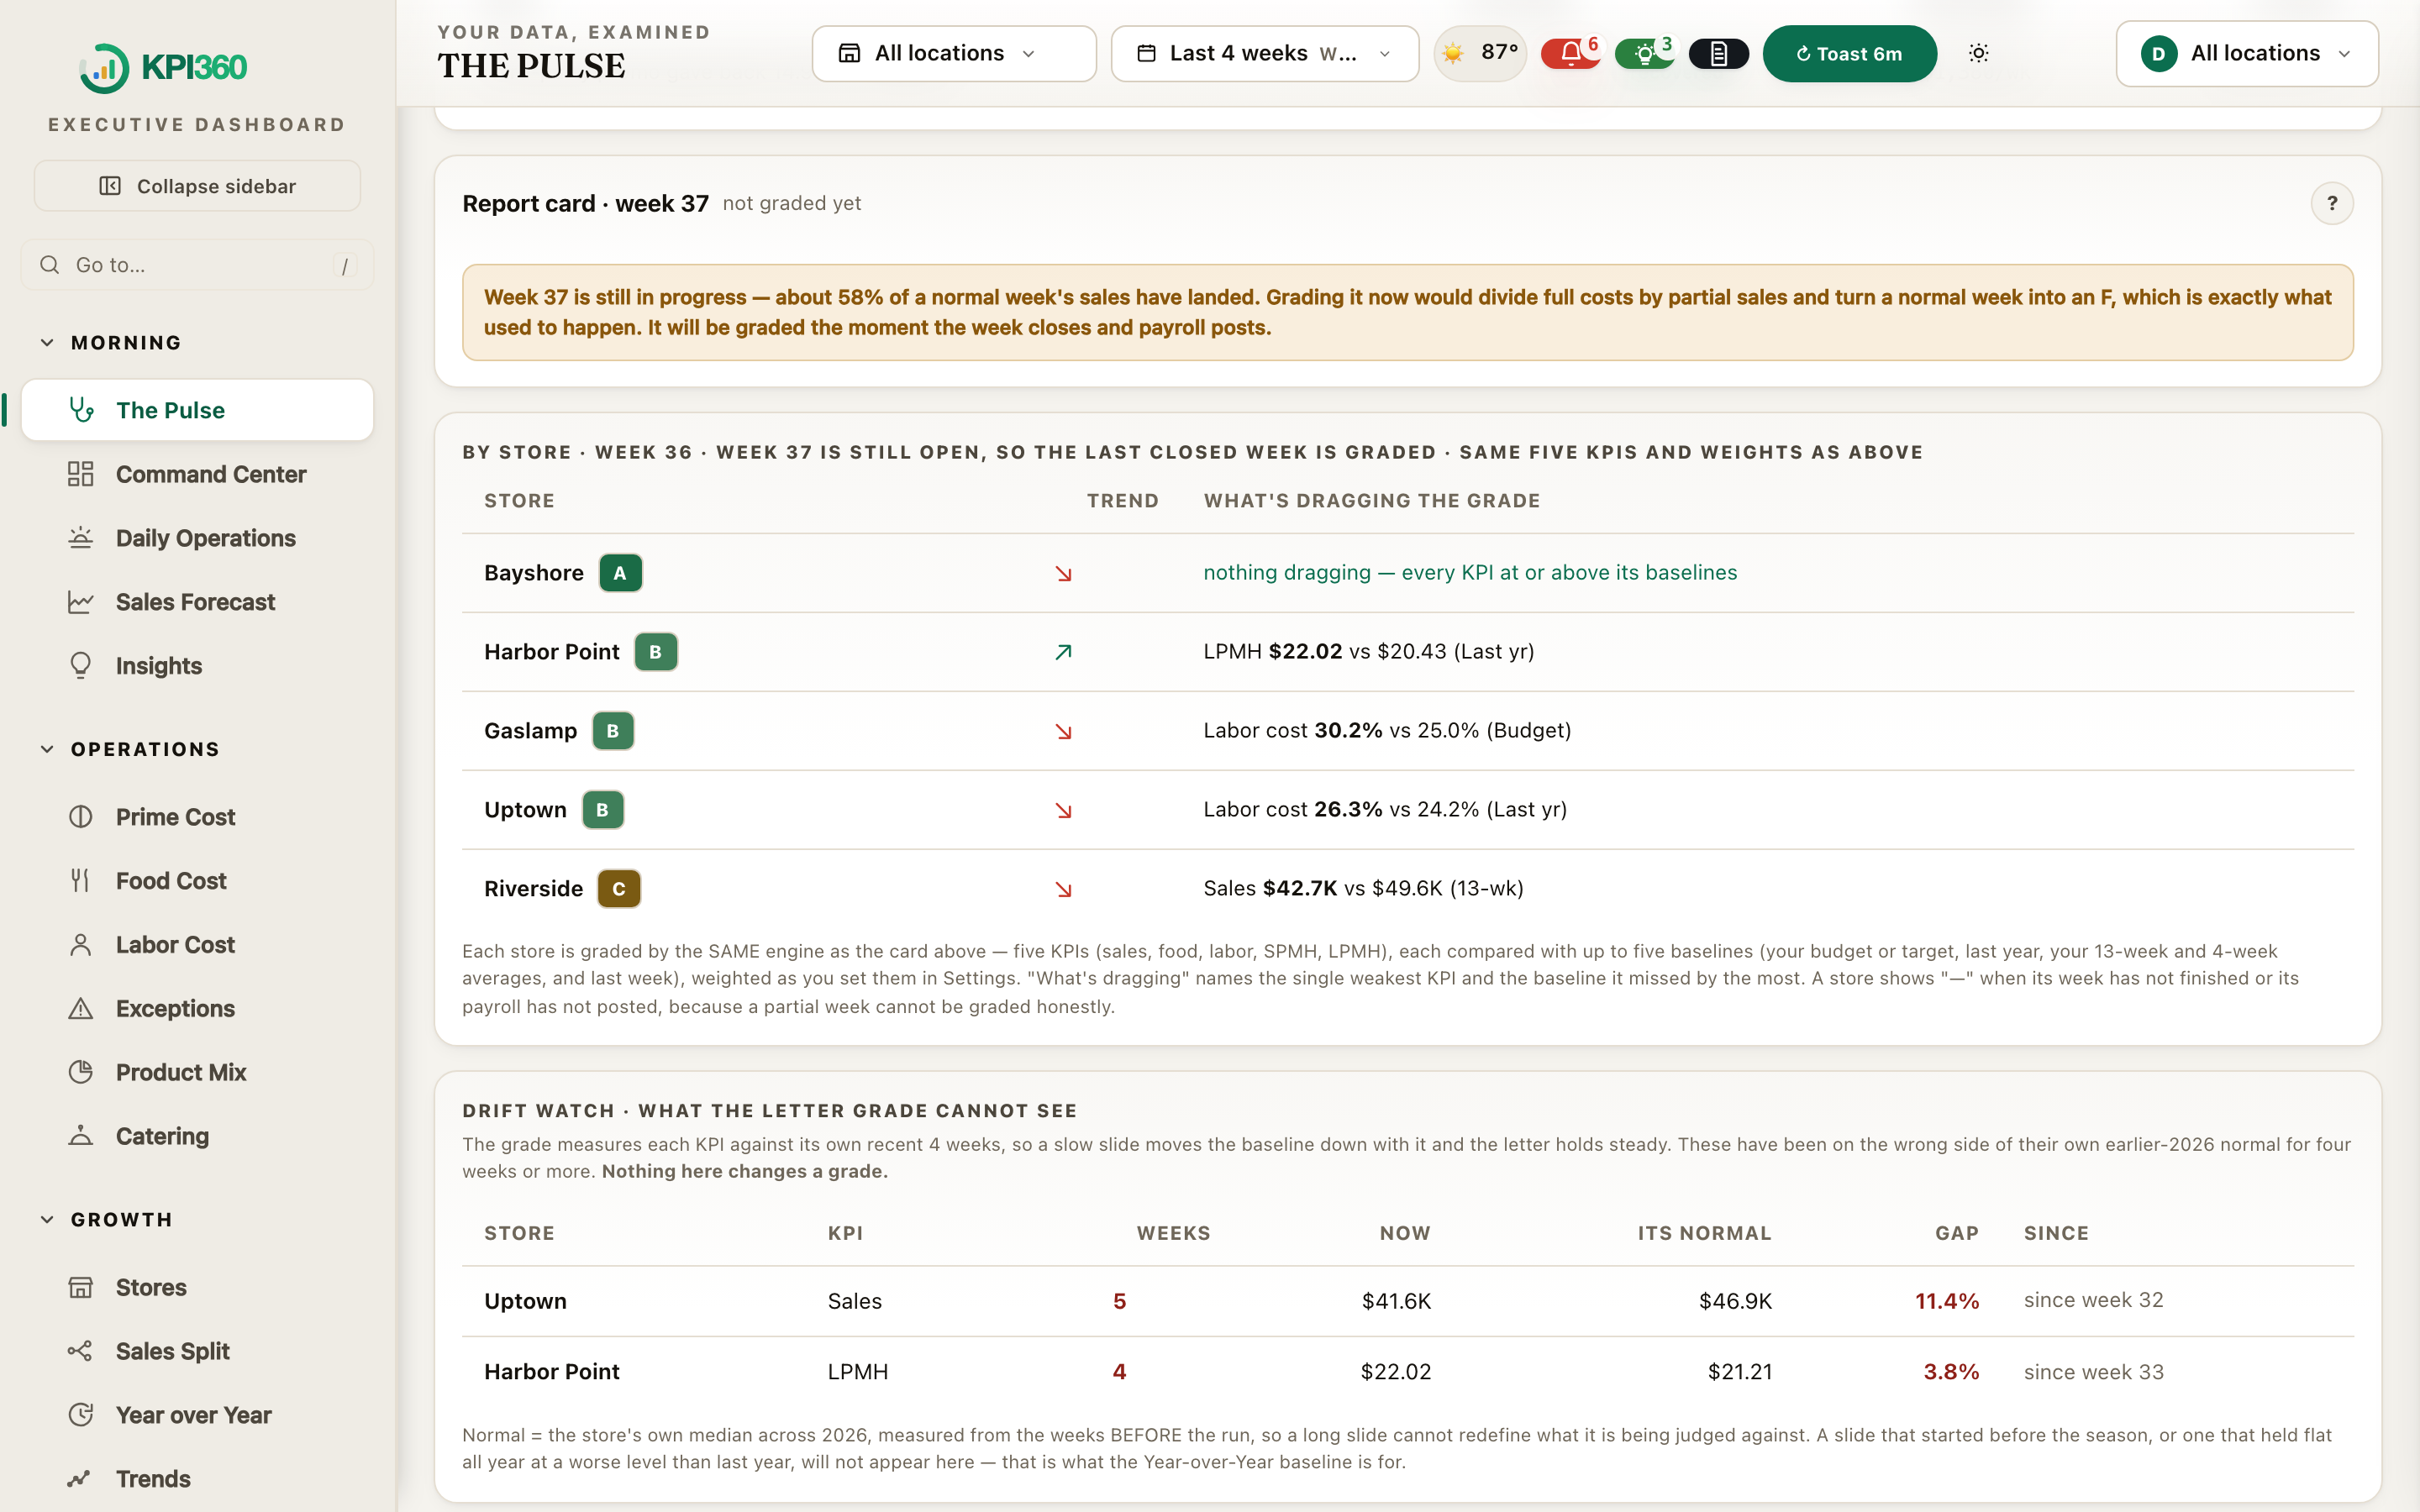
Every store, every week. The letter is built the way a good operator judges a week — against the target you set, with history as context, and never on a week that has not finished.
Sales, food cost, labor cost, sales per labor hour and labor cost per hour are each graded on their own — against your target first, then last year, the last thirteen weeks, the last four and last week — and weighted into one letter for the store and one for the company. Every letter opens: the baseline each KPI missed, by how much, and the direction of travel kept as a separate arrow.

Five KPIs graded on their own against your target and your history, then weighted into one letter — with the baseline each one missed. Photographed from the public demo — sample data, real software.
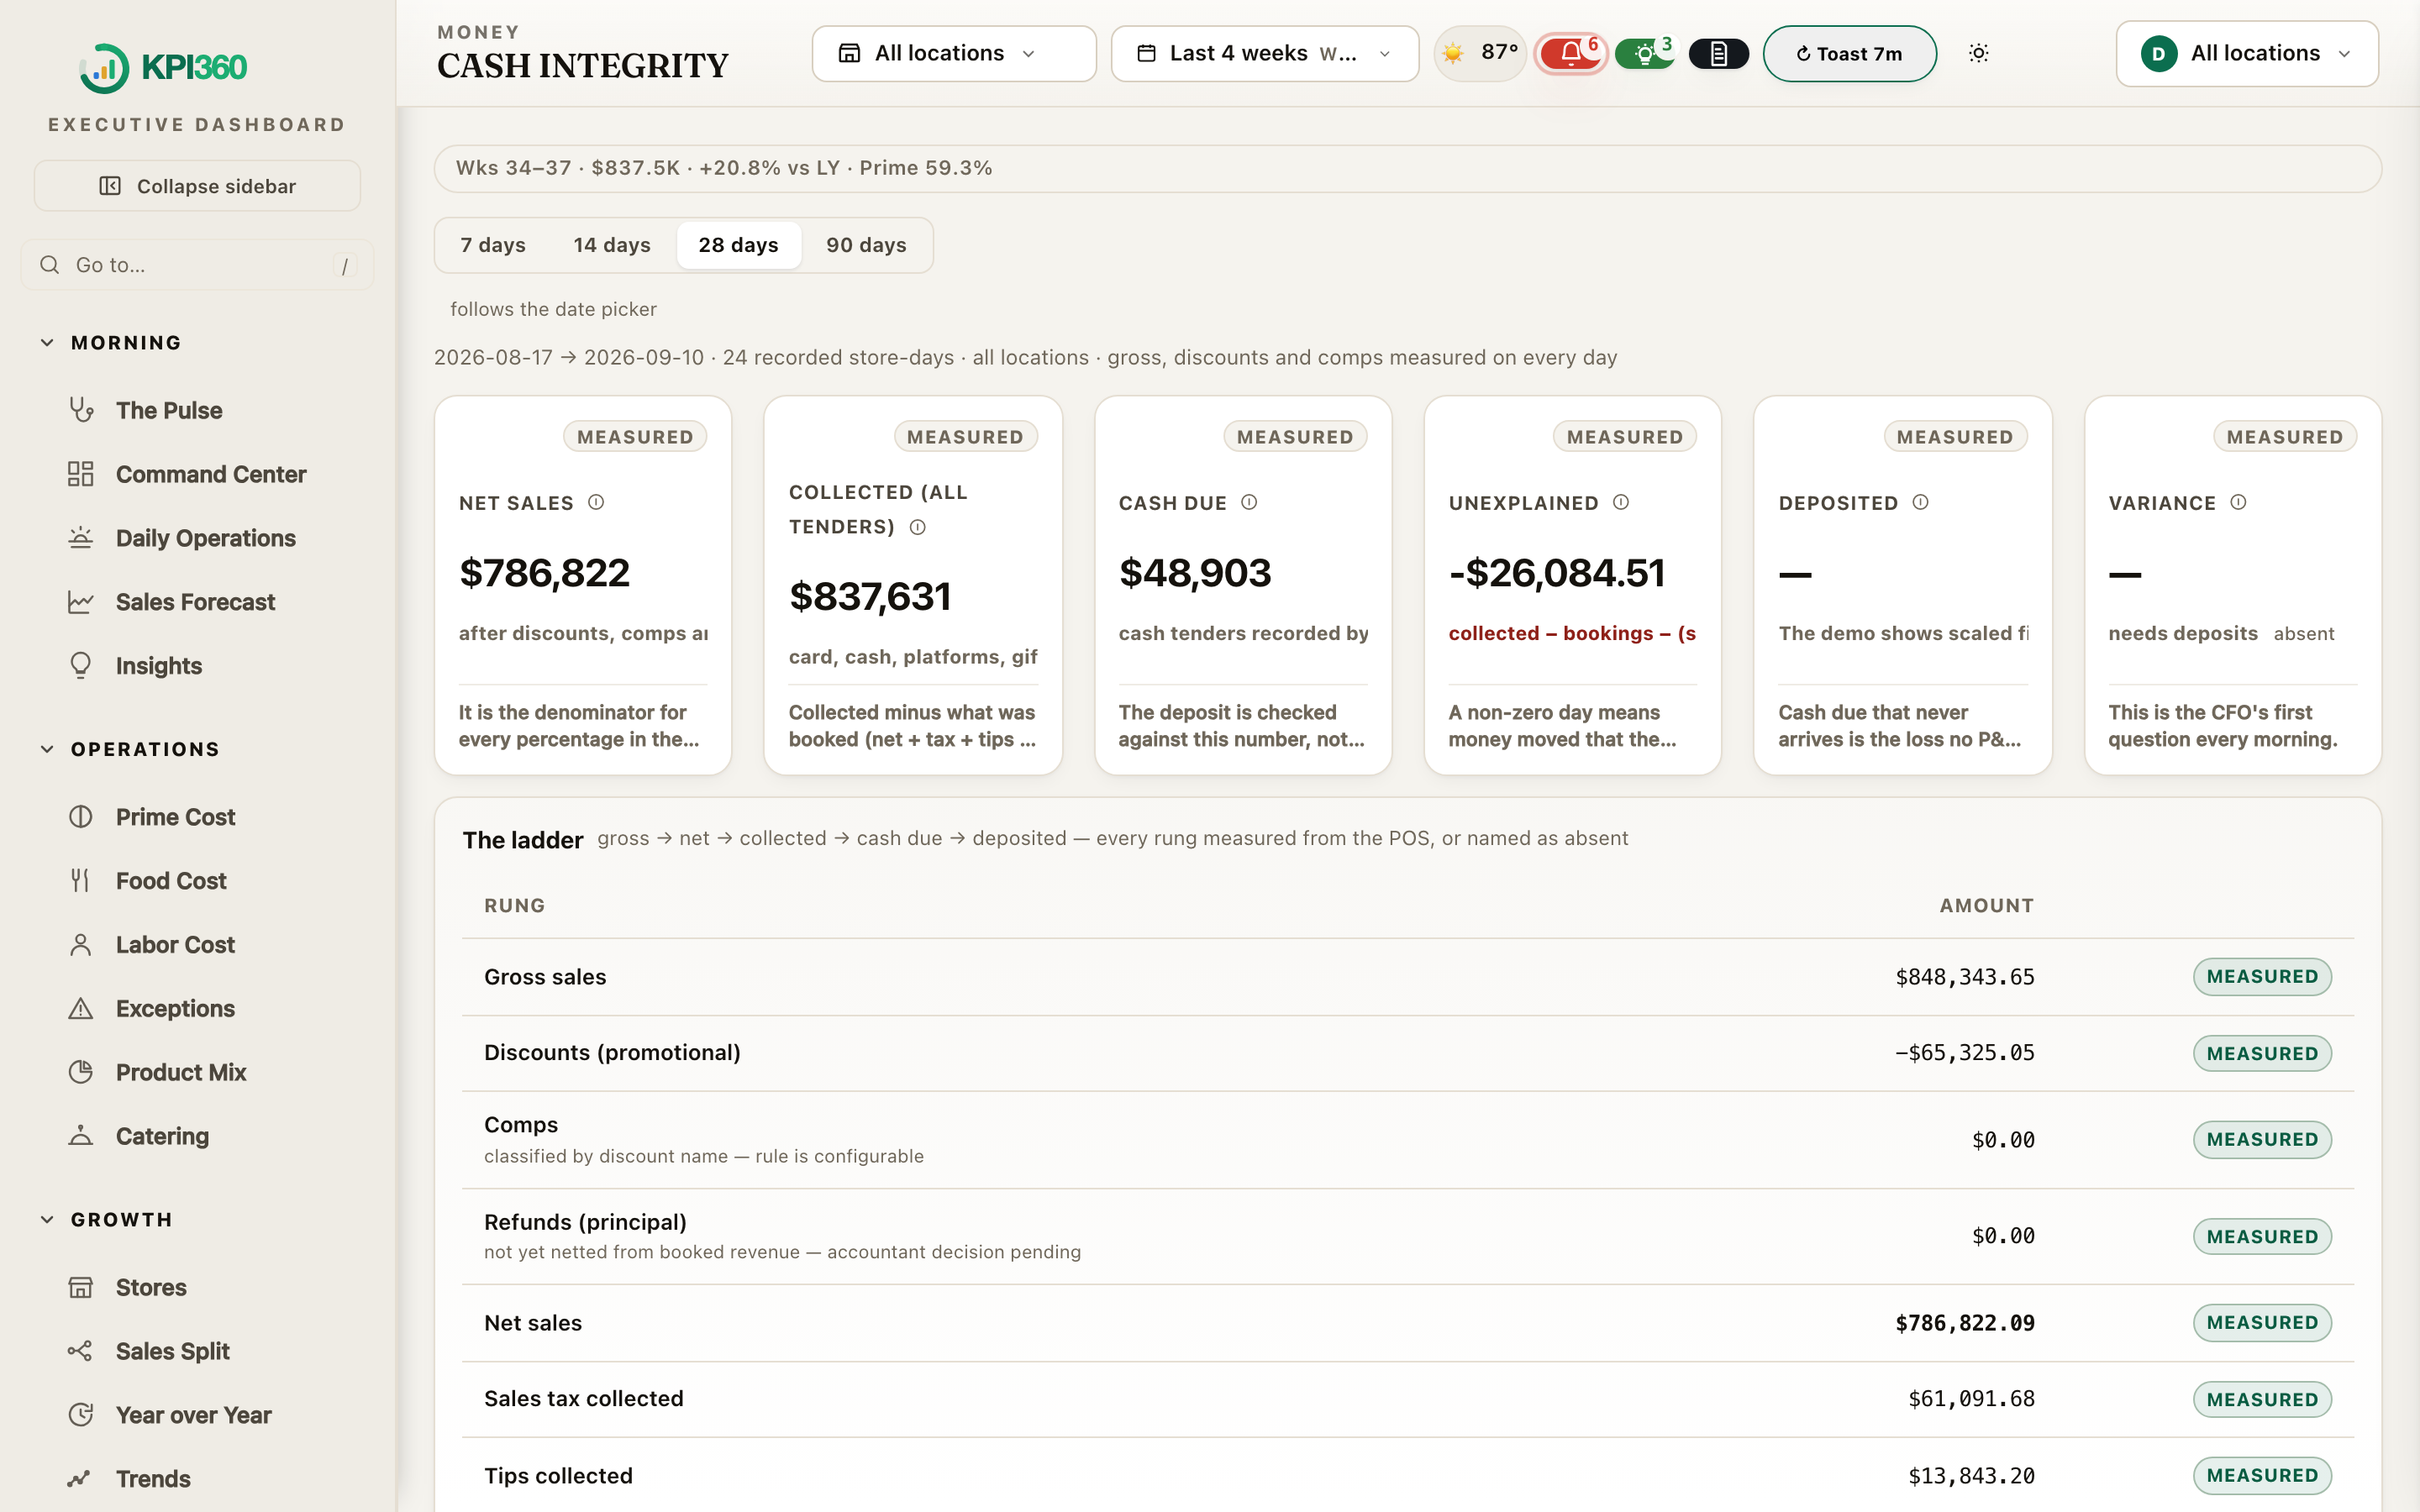
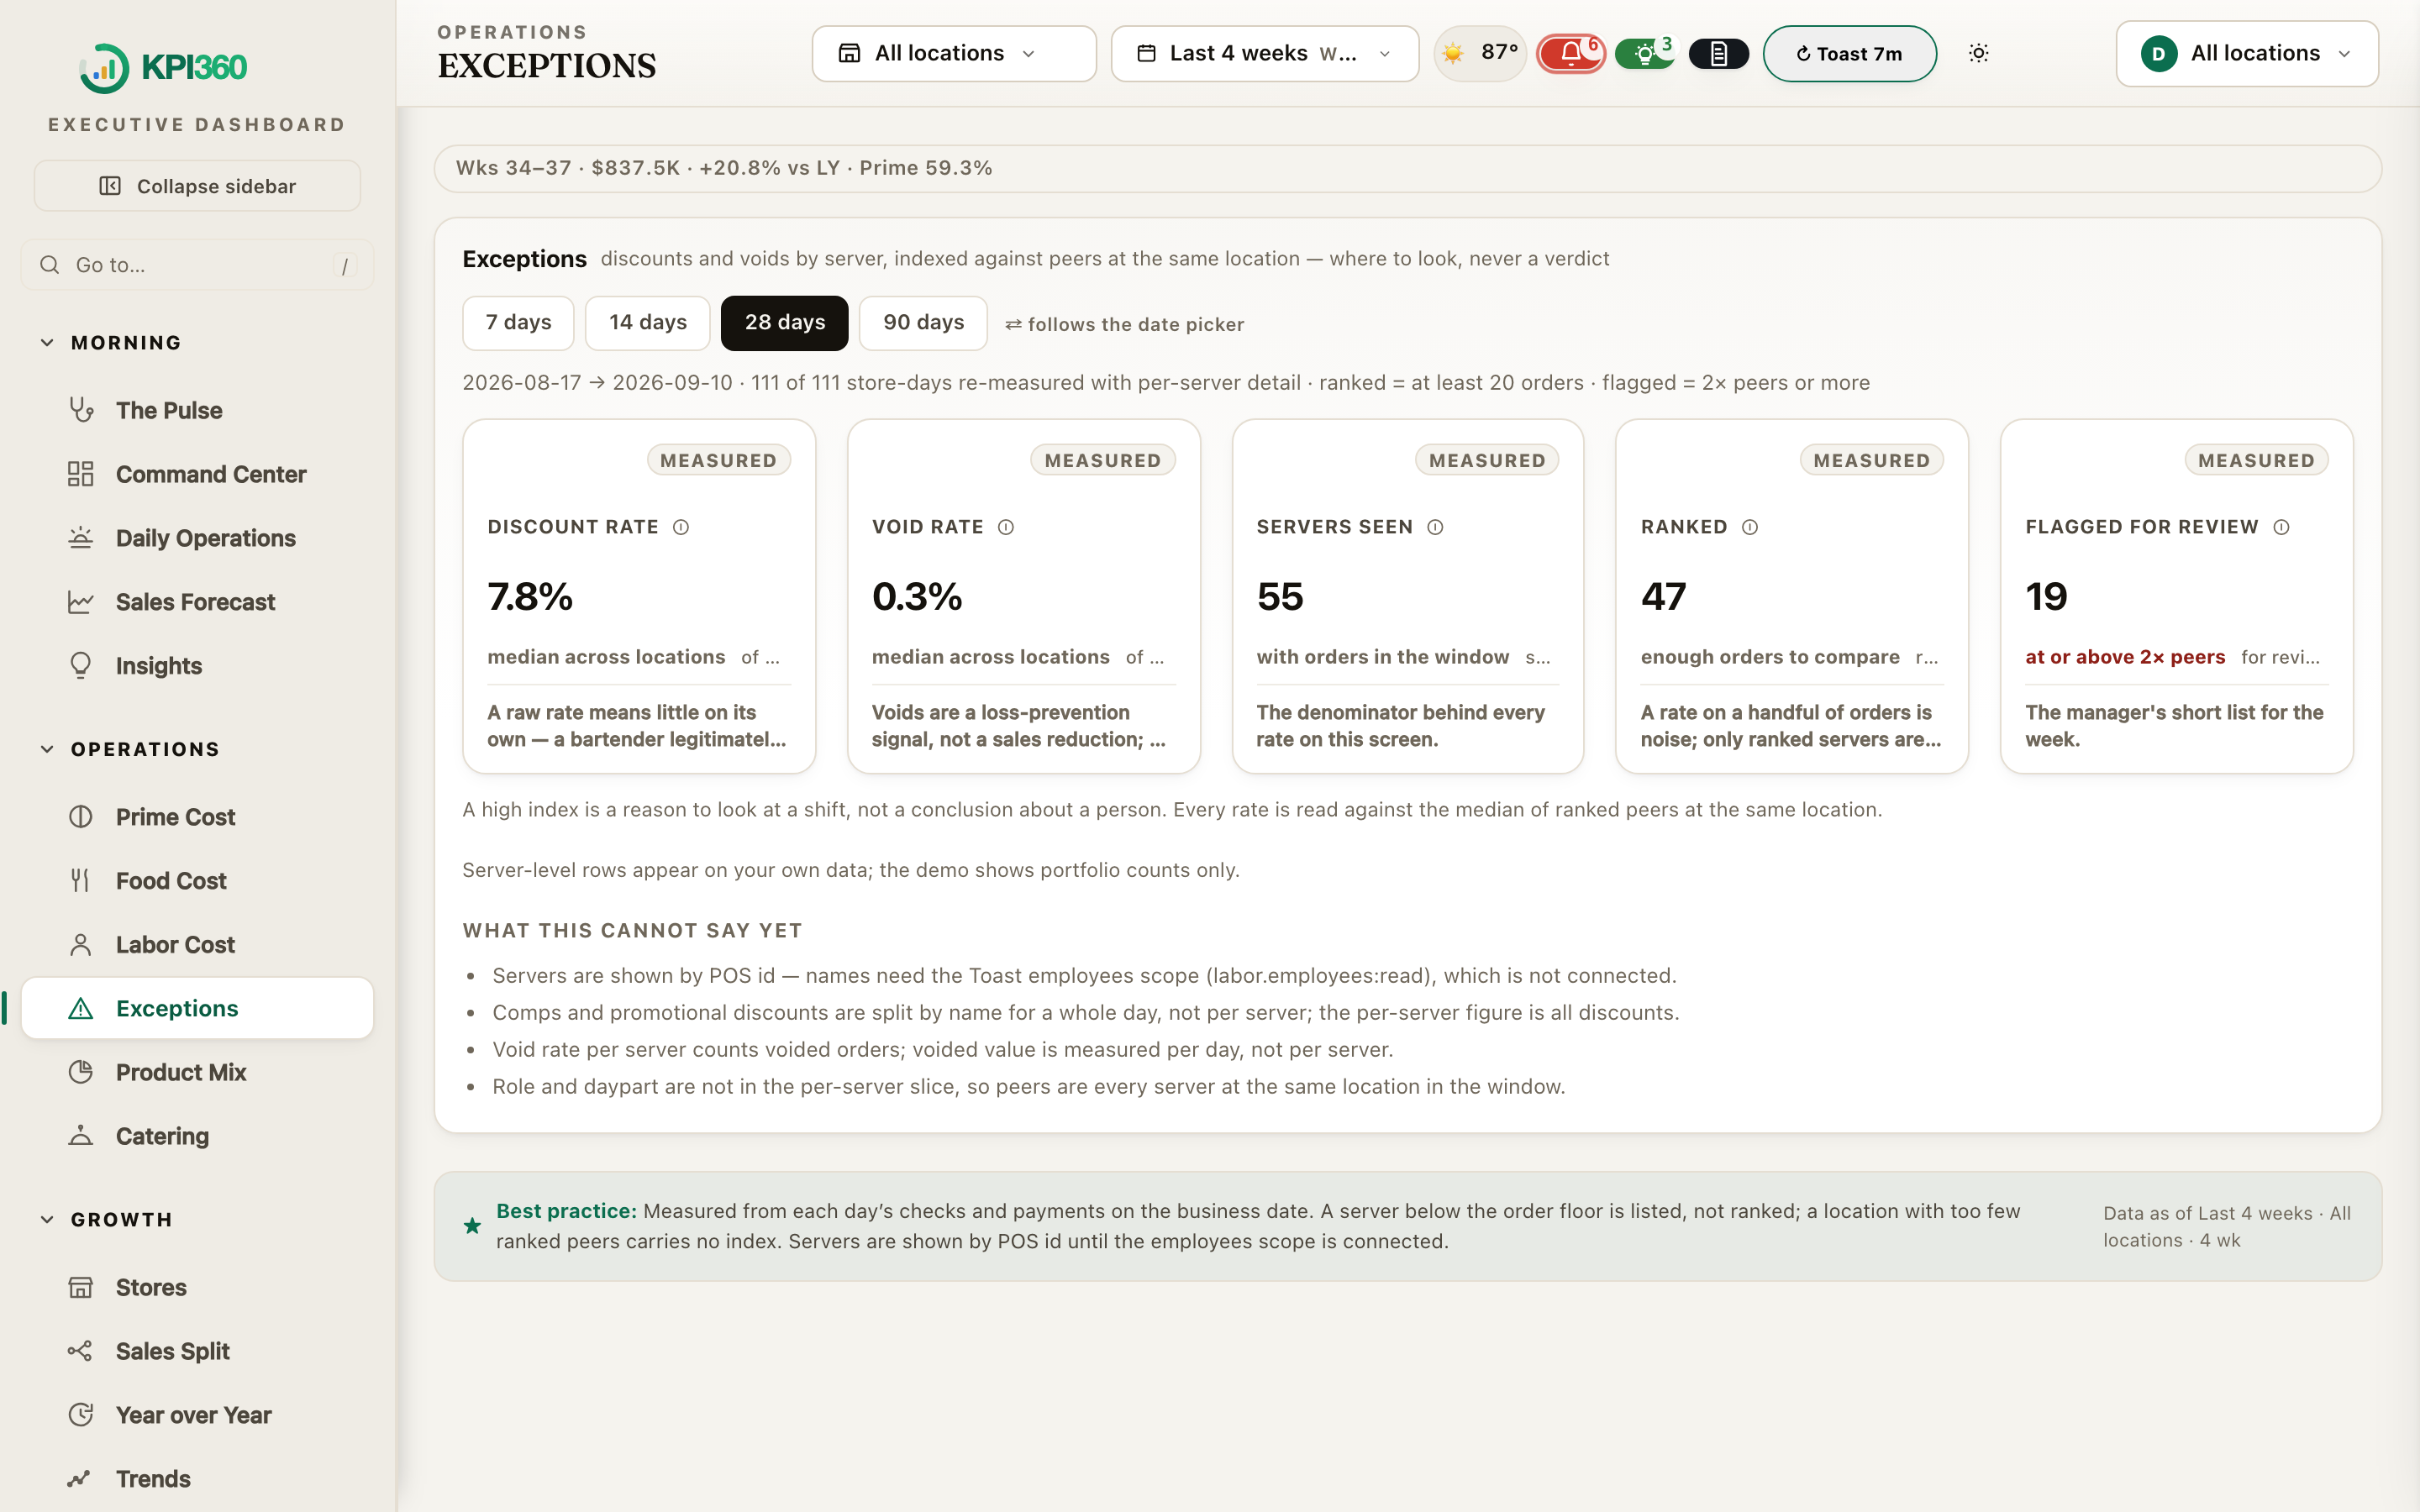
Cash Integrity walks every day from gross sales to the money collected and the cash due, step by step, and a step that was never measured says so rather than printing a zero. Exceptions indexes each server’s discount and void rate against that location’s own peers — POS ids only, never names — so it tells a manager where to look, not whom to blame.

From gross sales to the money collected and the cash due, step by step — a step never measured says so instead of printing $0.

Discount and void rates by server, indexed against that location's own peers. POS ids, never names; a question for a manager, never an accusation.
Photographed from the public demo — sample data, real software.
KPI360 is an MCP server. One token per company, made in Settings, and your assistant can list your locations, read the latest complete week’s KPIs against budget and last year, see the week’s weather outlook with its measured effect, and put a question to the CFO analyst in plain English. Read-only by construction: it explains and recommends, it never changes anything.
list_locationsget_kpisget_weather_outlookask_analystAnd then it is held to it. Every action you approve is measured four weeks on against a sister-store baseline, and the outcome ledger states the result in dollars only where the arithmetic is clean. An action with no detectable effect is counted and said — never dollarized. A window still running is named, never estimated.
Every week, KPI360's AI reads your P&L, product mix, labor and channels, then writes the brief and drafts the exact moves. You approve; it acts. No dashboards to decode.
The five things that changed, why, and the dollar impact — in plain English.
Schedule cuts, 3P renegotiation emails, menu actions — queued behind your approval.
“Why was Riverside down last week?” — answered from your real numbers, instantly.
Neither one can tell you whether you made money. KPI360 holds both sides at once — so the P&L, the cash position and the money that never landed all read from the same week.
$1,847 of Thursday’s third-party sales never reached the bank. Commission was deducted twice on the delivery payout. Sitting in neither system alone — only in the join.
The CFO opens the close. The ops director opens the exceptions. The GM opens the morning read. Three jobs, one set of definitions — so nobody spends the meeting arguing about whose number is right.
POS, payroll, vendor invoices and the general ledger land in the same screens, mapped to the same locations, checked against each other — with an AI accountant that reads your books the way a CFO would: GAAP-grounded, citing your own figures, flagging what to do this week. Not another dashboard beside the stack. The place the stack reports to.
Every night, KPI360 posts each restaurant’s daily sales journal entry into its own QuickBooks file — net sales, sales tax collected, tips, gratuity — in your bookkeeper’s own format, on the accounts your ledger already uses. No more hand-entering sales, no more months of catch-up. A month your bookkeeper has closed is never touched by a correction, every correction is previewed and reversible, and a post is create-only and duplicate-proof: it checks QuickBooks before every post, never edits, never deletes.
One switch. On when you’re ready, off any time — connecting your books never requires it.Prime cost, occupancy and flow-through — not a 300-line chart of accounts. Same week, every location, side by side.
What came in, what went out and what the books say is left — per company file, for the window you choose. The bank's own balance joins it when you connect the feed.
Receivables and payables by age, with the catering invoices that quietly slipped past sixty days pulled to the top.
Every report your books serve, on demand. It writes two kinds of thing and nothing else: the nightly sales journal, once you switch it on, and a correction you ask for — a missing account, a duplicate entry it posted itself, a reclass. Every one is previewed first, confirmed by typing, logged, and reversible.
Every close you have ever run was a checklist somebody ticked. This one is a measurement: each fact is either true of your data or it is not, and the ones that are waiting name the source they are waiting on.
Pick the bills, and KPI360 shows the run oldest-first against your cash cover — the bank, after payroll, after the reserve. Record this run writes the decision down: these bills, this date, by whom. Then it opens each bill where the money actually moves.
KPI360 never moves money. It proposes, records and opens — you release the payment in QuickBooks Bill Pay or Bill.com. Nothing on this platform can send a payment, and nothing is scheduled on your behalf.
Connect once — the data flows continuously and the dashboards build themselves.
Link Toast — or drop in any spreadsheet and the AI maps your columns. Read-only, no workflow change.
Sales, items, labor and costs stream in every 1–2 minutes — or on every upload.
Dashboards, product-mix and channel intelligence build themselves.
An AI brief and operator agent surface the moves and draft them for you.
One table, kept current. A connection that is built but waiting on a key from you says so rather than appearing as though it were running.
| Connection | What it reads | What it writes | Today |
|---|---|---|---|
| Toast POS | Orders, items, labor hours, dining options, tenders — 24 months on connection, then every one to two minutes. The history checks itself: every week’s two records are compared and re-read when they disagree, and an option Toast can no longer name is named once and kept. | Nothing | Live |
| QuickBooks Online | Profit & loss, balance sheet, cash flow, A/P and A/R ageing, deposits, vendors, your chart of accounts — one company file per restaurant | The nightly sales journal, once you switch it on · corrections you approve, each previewed and reversible | Live |
| Restaurant365 | Daily sales, labor punches, vendor invoices. Your R365 locations are matched to your restaurants before a single number is used — where the names leave doubt, KPI360 asks rather than guessing. Access is issued through your Customer Success Manager, and the credential is tested before it is stored | Nothing today | Live |
| Google Sheets | Cost sheets, payroll, budget and last year — however your sheets are laid out | Nothing | Live |
| Weather & your calendar | Each restaurant’s own weather, US holidays, paydays, school breaks, street closures permitted on its block | Nothing | Live |
| Bill.com | Vendors and open bills, so A/P shows every bill once whichever system it came from | Nothing — you release payments in Bill.com | Built · waiting on your keys |
| Plaid | Your bank’s own balances, cash deposits and debits — the half of the cash ladder nothing else can measure | Nothing | Built · waiting on your keys |
KPI360 never moves money and never sends anything on your behalf. It reads six systems and writes two kinds of entry into one of them, both of which you switch on and can switch off.
KPI360 reads your logo and colors and re-skins the entire platform to match — light and dark. Every concept you run gets its own branded command center on its own subdomain, with fully isolated data. One operator, or fifty.
Operate ten concepts under one umbrella? Onboard each brand once — its own POS or spreadsheet, its own look, its own isolated data. Then read the whole portfolio consolidated, or drill into a single brand in one click.
That 4–8% figure is the National Restaurant Association's — food-cost variance nobody caught, labor drifting a point, sales data nobody read. KPI360 exists to catch it. The calculator below assumes you recover just 0.5% — the conservative end of what operators report.
Keep Toast's built-in reports — they're good, and KPI360 reads from the same source. The difference is the layer on top: not another dashboard, an analyst.
Read-only on top of your existing Toast — a five-minute connect, and nothing about service changes.
Eleven things a multi-unit operator actually needs from the numbers, and who offers them. Full means it is there and works without a data team. Partial means it exists with real caveats: an add-on, something you have to build, or a narrower version.
| Capability | KPI360 | Tenzo | Restaurant365 | Avero | Power BI | Toast |
|---|---|---|---|---|---|---|
| Restaurant-native metric definitions | Full | Full | Full | Full | Not offered | Full |
| Weekly prime cost vs benchmark band | Full | Partial | Full | Partial | Not offered | Partial |
| Cash due vs deposited reconciliationmeasured both sides: cash due per restaurant per day from the till, deposited from your bank feed — connect the bank and the ladder closes to the penny | Full | Not offered | Partial | Not offered | Not offered | Partial |
| Sales bridge: traffic, check, mix, price | Full | Partial | Partial | Partial | Full | Not offered |
| Menu engineering on margin dollars | Full | Partial | Full | Full | Not offered | Partial |
| Anomaly flag with named driver | Full | Partial | Not offered | Not offered | Full | Not offered |
| Void, comp and discount exceptions | Full | Partial | Partial | Full | Not offered | Partial |
| Receipt-level drill from any KPI | Full | Partial | Full | Full | Full | Full |
| Demand forecasting on weather, events and your own calendar | Full | Full | Full | Partial | Full | Partial |
| Usable without a data team | Full | Full | Not offered | Full | Not offered | Full |
| Published, predictable pricing | Full | Not offered | Partial | Not offered | Partial | Full |
Most forecasting features are a rule someone wrote down: rain is bad for lunch, a holiday is good for dinner. KPI360 does not assume any of that. It measures each effect against your own sales, one restaurant at a time, and applies it only where it is real.
Your own numbers, on your own calendar, with the arithmetic in the open. That is the difference between a forecast you can schedule against and one you argue with.
The other columns reflect each product's published capabilities as we read them on 3 September 2026, and we keep them current. KPI360's column is what ships today, not a roadmap. If we have one wrong, tell us and we will correct it.
You're billed only for the POS locations you connect — detected automatically.
No. KPI360 reads from Toast and your existing sheets — read-only. It writes to your books in two cases only: the optional nightly sales journal, after you switch it on, and a correction you ask it to make — each previewed, confirmed by typing, written to the record of changes, and reversible. Your team keeps working exactly as they do; the platform gives you one live view on top.
Keep them — KPI360 reads the same data. Toast's dashboards are descriptive: they show you the numbers. KPI360 is prescriptive: it compares every location against last year, budget and its own baseline, flags the few things that are actually costing you money with a dollar figure attached, and drafts the fix for your approval. It's the difference between a report and an analyst.
Drop in any spreadsheet — a Google Sheet or CSV export from your POS, back-office or accountant. Our AI reads your headers and sample rows and maps them to KPI360's fields; you confirm, and your dashboards populate. No fixed template, no Toast required.
Yes. A holding company can onboard each brand once — its own data source, branding and isolated workspace — and admins see the whole portfolio consolidated or drill into a single brand. Brand teams only ever see their own numbers.
$99 per connected POS location per month — every feature included, no tiers, no free-trial expiry games. We detect how many locations you connect and bill only for those. Add or remove a location, the bill adjusts.
Same day. Connect Toast and your sheets, paste your website to brand it, and your command center is populated within minutes — smarter every week as the AI learns your patterns.
Never without you. The operator agent drafts actions and nothing happens until you approve it with one click. The one exception is the one you explicitly switch on: Books Autopilot posts each day’s sales journal nightly — off by default, one switch, create-only and duplicate-proof, and reviewable line by line on the Journal Entries screen.
Every tenant's data lives in its own isolated namespace, limited to the team you invite. One concept never sees another's numbers.
Strong security practices, plain-English policies, and a Data Processing Addendum ready for your clients.
TLS in transit, encryption at rest. Credentials never touch the browser.
Each client runs in its own workspace — no cross-company access, ever.
Export anytime. We never sell it, and outside models are never trained on it.
GDPR & CCPA-aligned with a DPA available. Read our security →
Built with multi-location operators and running in production across 12 locations today. Bring your team in and see your week at a glance.
Get started →